Closing the “EV Renter Gap”

Closing the “EV Renter Gap”

Adam Borison and Greg Hamm

One-third of all US households are occupied by renters rather than homeowners, and there are nearly fifty million rental households nationwide. In some regions, the fraction of renters is considerably higher. In Los Angeles and New York for example, this figure is estimated to be more than 60%. Clearly, rental households represent a very important market segment.

Unfortunately, when it comes to transportation electrification or e-mobility, this market segment is woefully under-represented. Renters are perhaps a third as likely as homeowners to own an electric vehicle (EV). As the figure below from U.C. Berkeley Professor Lucas Davis shows, this is true even when adjusted for household income.[1]

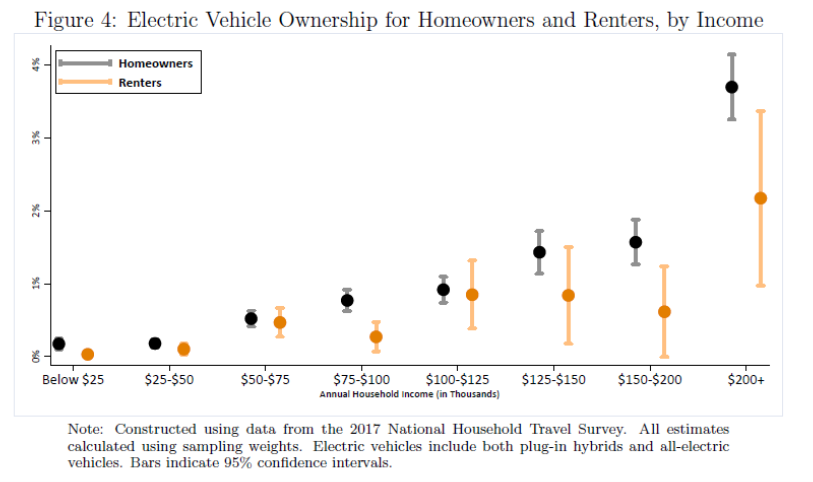
To achieve ambitious e-mobility goals and extend the advantages of EV’s beyond the core niche of wealthy, single-family homeowners, this is an issue that we need to address.

There are a variety of reasons cited for this “EV renter gap.” One that is frequently mentioned is simply the high cost of installing electric vehicle supply equipment (EVSE) – aka an EV charger – in typical multifamily rental properties. The International Council on Clean Transportation, for example, estimates that the installation cost of the most common Level 2 charger is roughly three times higher for an apartment ($4100) than for a single-family home ($1400).[2] This added cost can go a long way to discouraging EV adoption.

Our view, however, is that this simple economic comparison can be misleading because it is framed as the installation of an individual charger rather than a group of chargers. If we envision the widespread adoption of EV’s, we should not be thinking in terms of a few individual EVSE’s. Rather we should be thinking “at scale.” Rather than considering a single charger then, consider installing 100 EVSE’s in a neighborhood of 500 single-family homes versus 100 EVSE’s in a 500-unit apartment building. The table below compares the upfront costs of each element of this at-scale installation.

ElementRental ApartmentOwned HomeAdvantage
FeederUpgrade of a single large transformerUpgrade of multiple smaller transformers over a large areaApartment
Line to EVSEUpgrade may be required of line to garage or multiple lines to scattered parkingRarely will require a line upgradeHome
PanelRequires a single large panel or a few smaller panels in a single locationSizable fraction of homes over a large area will require a panel upgradeApartment
EVSESingle sophisticated control system and single installation site for high-power charger.Many installation sites with individual low-power hardware and softwareApartment
MeterMetering combined with control systems to lower costSizable fraction of homes over a large area will require metering upgradeApartment

This simple qualitative view suggests that, at scale, EVSE installation for renters rather than homeowners has numerous advantages, and costs may actually be lower for renters rather than homeowners. It also suggests two important follow-up questions.

  • What is the actual quantitative cost comparison now and in the foreseeable future?
  • Assuming rental apartments actually have an EVSE advantage at scale, what government policies or business practices are required to fund the required investment and overcome this apparent market failure?

“Watch this space” for more on this important topic.


[1] Lucas Davis, Evidence of a Homeowner-Renter Gap for Electric Vehicles, Energy Institute at Haas, July 2018.

[2] Michael Nicholas, Estimating electric vehicle charging infrastructure costs across major U.S. metropolitan areas, The International Council on Clean Transportation, August 2019.

Posted in General | Leave a comment

Public EV Chargers

Public EV Chargers

My prior blog discussed global differences in current and predicted EV adoption.  As a follow-up, I wanted to discuss global EV charging patterns.  The focus here is on charging for light duty vehicles. A recent study has extensively examined and compared global patterns in charging.  I have spent way too much time dissecting this report. My conclusion is that countries are taking alternate paths to charging and no one knows what charging strategy is the most efficient at encouraging PEV sales.

I have focused on one report that summarizes the charging situation across several countries and regions.  The study is  “How much charging infrastructure do electric vehicles need? A review of the evidence and international comparison,” Simon Árpád Funke, Frances Sprei, Till Gnann, Patrick Plötz. Transportation Research Part D 77 (2019) 224–242. (Link here, I will refer to this study as “Funke, et al”) They review 26 papers and from this review state four stylized facts (SF) about charging infrastructure.  The countries covered are the US, China, Japan, Norway, France, Sweden, UK, Netherlands, Germany, and Poland. Collectively these countries account for just over 93% of the world stock of PEV’s in 2018 (Wikipedia link).

The stylized facts are:

  1. The availability of charging infrastructure supports PEV diffusion. Funke, et al list a number of reports that indicate charging infrastructure, private and public, is important to encourage PEV sales. (p.229) Somewhat more particularly, the authors find studies consistently show that more public charging correlates with more PEV sales; however, they emphasize that this is a weak empirical relationship. They note that less than 10% of charging events occur at  public charging stations. (p. 225)

For the countries covered in the report, there is no clear relationship between PEV sales shares in 2017 and PEV’s per charge point. (p.233) Norway with 39% PEV sales share has 19 PEV’s per charge point; the US with 1% sales share has 17 PEV’s per charge point.  One might think that a negative relationship makes sense.  Establishment of public infrastructure must lead the sales of PEV’s. Poland suggests this, it has less than 0.1% PEV market share and one charge point for every 4 PEV’s. But the Netherlands with 3% PEV sales share (third highest in the sample) also has only one charge point per every 4 PEV’s.

  1. Broad availability of home charging infrastructure is sufficient for the early market diffusion of PEV’s. I found their arguments for this to be weak.  Their arguments are:
    1. Both quantitative and non-quantitative analyses have shown that availability of home charging is very important to PEV purchasers. (Funke, et al. p.229)
    2. Home charging is heavily used. “50-80% of charging events happen at home.” (Ibid, p.234)
    3. In all but one of the countries (Netherlands) the share of detached houses is above 25%. (Ibid, p.234). This means a large portion of households have a potential place for home charging.
    4. An analysis of average daily driving mileage and kWh/mile indicates that a reliance on home charging is feasible. (Ibid, p.235)

“A.” and “B.”  suggest strongly that home charging availability is important and very desirable, but do not speak to its sufficiency. “C.” and “D.” suggest that for many countries EV penetration is feasible based on home charging, but again are not evidence that it is sufficient for early adoption. The consistent empirical correlation of public charging with PEV penetration, noted above, suggests to me that it may be important in both early and more mature markets.

Evidence supports a related conclusion: “Since Norway is also the most developed PEV market, the data underlines that a high VRI (PEV to charge point ratio) is not an appropriate metric to indicate further charging infrastructure expansion needs, at least not without additional data on market maturity.” (Ibid, p.236) Norway has reached the world’s highest penetration of PEV’s with the fewest charge points per PEV in the sample.

  1. Public slow charging infrastructure is only needed as a substitute for home charging, since charging at points of interest (POI) has a limited effect on the diffusion of PEV’s.  This “fact” is largely based on the Netherlands. The Netherlands is different from the other countries examined in a number of ways. The Netherlands has an urban population of 92% and the highest population density of the countries examined. It has the lowest percentage of detached housing in the sample (note, no detached housing data is available for China).  PEV’s had a sales share of 3% in the Netherlands in 2017, only Norway (39%) and Sweden (6%) had a higher share in the sample.  The Netherlands had the second highest (behind Norway) level of PEV registrations per 1000 inhabitants, 6.9. (Ibid, p. 233) The Netherlands is tied for the most public chargers per car in the sample, 1 public charger for every 4 PEV’s. Only 1% of the The Netherlands chargers are fast DC.  Fast DC chargers are 8% to 38% of public chargers for the rest of the sample. The Netherlands has shown that public slow chargers can be a substitute for home charging.

    Note that urban China and Japan also have limited detached housing.  In these countries, it appears that a somewhat denser network of fast DC chargers substitute for non-existent home charging.
  2. DC high power charging infrastructure is mainly needed for BEV long-distance trips. This is certainly logical. Most PEV’s are charged at home or work and most trips are within the PEV driving range.  Obviously, BEV’s cannot be driven beyond their range without charging and slow charging would be terribly inconvenient.  But if this is true, I would expect to see a positive correlation between BEV share and the density of charging. I don’t find such a relationship in the presented data.

    France (78%), China (77%), and Norway (66%) have the highest BEV shares within PEV’s. (Ibid, p.233) Based on “Highway km per DC-CP” (smaller means denser DC high power coverage) France has a middle of the pack 7, China has lower 2, and Norway has an extremely low 0.4. (Ibid, p.237)  Three countries with low to moderate BEV shares UK(34%), Sweden(25%), and Japan(51%) also have dense DC fast charger networks based on the “Highway km per DC-CP” measure.  The values are UK – 1, Sweden – 3, and Japan – 1. If we look at another measure of DC fast charger density “Average radius [km] around a DC-CP” we see a similar lack of correlation between BEV shares and DC high power infrastructure. 

The “stylized facts” in Funke, et al are logical, but the presented data indicate a lack of strong consistent patterns across countries that support these facts. This suggests that other factors such as subsidized pricing, country specific driving and housing patterns, the history of EV model availability, and attitudes towards green products have been more significant than charging infrastructure in determining PEV penetration. We are in the early days of mobility electrification. There is no clear template about what infrastructure is needed in a particular country. It would be wise for countries to invest moderately but diversely in charging infrastructure and then move quickly to reinforce the charging infrastructure that is most demanded.

Posted in General | Leave a comment

Global E-Mobility: Where does the US stand?

Global E-Mobility: Where does the US stand?

I have participated in several consulting projects and co-authored papers on e-mobility (With Dr. Adam Borison of Nathan. Papers here.), but this work has all been US centered.  I wanted to know if the US experience and future was typical of the globe. Here are the highlights of what I have found out so far.  While I will note several other sources, the IEA (International Energy Agency)  “Global EV Outlook 2020, Entering the decade of electric drive?” is my major resource.  This report can be found here. I will refer to this report as Outlook 2020.

In the US and globally when we talk about e-mobility, electric passenger cars or light duty vehicles (LDV) are foremost in our minds.  The graph below based on Outlook 2020 (p. 44) shows the 2019 EV stock and sales shares for passenger cars.

Globally there are 7.2 million EV passenger cars (scale on the left).  6.6 million are in the three regions shown in the graph.  China with 3.4 million has by far the largest fleet.  The sales share (scale on the right) is the more interesting number.  In 2019, 1.8% of cars sold in the US were EV’s.  In Europe the share was almost double this at 3.5% and in China it was almost triple this at 4.7%.  This indicates that EV’s are growing much more rapidly in these markets.

The number and market share of passenger cars is not very informative with respect to energy use, climate change, or global e-mobility. The figure below, derived mainly from Outlook 2020 (p. 172), shows the electricity demand from different EV’s in 2019.

The estimated total energy use by electric vehicles in 2019 was about 80 terrawatt hours (TWh).  This is about 0.3% of the electric energy generated globally.  EV’s are not yet having a significant impact on global generation and, therefore, not much impact on climate change.  Light duty vehicles (passenger cars, SUV’s, light trucks and vans). Use about 21% of the energy. Larger vehicles, buses and trucks, use about 15% of the energy.  The real surprise to me is that electrified two and three wheelers use 63% of the energy.  These vehicles – hardly noticed in the US – currently dominate the EV space.  

While the individual energy use of two and three wheelers is small, the Chinese fleet is over 350 million vehicles. Two and three wheelers are enormously popular throughout Southeast Asia including India.  Both the immediate and long run environmental value of converting these fleets to electric would be enormous. For example, two and three wheelers are responsible for approximately 20% of CO2 and 30% of particulate emissions in India (Outlook 2020, p. 61).

When we look at the geographic distribution of this broader range of vehicles.  China’s current dominance of the EV space becomes clearer.  Approximately 98% of the global bus fleet is in China (Outlook 2020, p.63). Over 95% of the 2019 medium and heavy truck EV fleet sales were in China with similar proportions since 2015 (Outlook 2020, p. 66).  Over 98% of the global two and three wheeler fleet is in China (Outlook 2020, p.62-63).

Other significant global contrasts in 2019 include industry structure and charging.  The US EV industry is dominated by Tesla.  In 2019, the Tesla Model 3 had a 47% share and Tesla had a 58% share among EV’s (US data).  Tesla also led the European market, but Europe is much less concentrated.  The Tesla 3 had a 17% share and the Tesla brand had less than a 20% share (European data).  China is similarly competitive. The top Chinese model had only an 8% share and the top Chinese brand had less than 25% share (Chinese data). “Publicly accessible chargers accounted for 12% (862,000) of global LDV chargers in 2019…” China is home to 50% of the slow chargers and 80% of the fast chargers (charge capacity greater than 22kW) in the world. (Outlook 2020, p.76)

Outlook 2020 examines two scenarios for EV growth to 2020, a Stated Policies Scenario (STEPS) which is based on existing and announced policy measures and a Sustainable Development Scenario (SDS) which projects EV growth at a level compatible with the Paris Agreement climate goals.  The table below shows the STEPS, SDS, and an alternative Deloitte forecast (Outlook 2020, p.156 and Deloitte forecast).

Scenario2030 Electric LDV SalesMillion2030 Electric LDV Share%
STEPS2517
SDS4533
Deloitte3132
Electric LDV Sales and Share

The SDS is almost double the STEPS.  While the Deloitte sales forecast is closer to the STEPS forecast, the Deloitte share forecast is nearly identical with the SDS forecast.  Deloitte is predicting much lower overall global car sales, but is relatively optimistic about the penetration of EV’s. I believe that one major difference is the Deloitte report more fully integrates the impact of the Covid 19 crises and is more negative regarding global economic growth.

The graph below is drawn from Outlook 2020 (p.158-161).  It reflects the optimistic 30% plus LDV penetration suggested by the SDS and Deloitte estimates.  Outlook 2020 provides rest-of-world rather than global data.  I estimated global data based on 2030 regional car sales found here.

This graph shows interesting diversity; on a market share basis, the leaders are US – Truck, Europe – LDV, China – T/T (2/3 Wheeler) and Bus.  The US significantly lags the other two regions and the globe in everything but Truck market share. The large 2/3 Wheeler market in Southeast Asia including China and India has very high adoption of EV’s pushing global sales to almost 80% market share. 

The huge size of the Chinese market makes it the leader in all modes by stock and sales vehicle count. For example in 2030, China sales of EV’s would be about 16 million and the US would be about 6 million. The global EV LDV stock share is 8% in the STEPS and 14% in the SDS.  The global EV bus stock share is 7% in the STEPS and 12% in the SDS. (Outlook 2020, p.156-157)

Overall, the impact of EV’s on demand is between 550 TWh and 1000 TWh in 2030. This is between 1% and 2% of total electricity demand. In Europe and the US, EV’s could account for as much as 6% and 4% of demand respectively (Outlook 2020, p. 171).  Examining the electricity demand by mode, the demand from 2/3-wheelers grows significantly but it is replaced by LDV’s as the largest demand on the electric system. LDV’s constitute about 750 TWh of demand in the SDS.  Examining US and China data on commercial LDV’s (US commercial data and China commercial data) suggests that globally about 8% to 15% of LDV’s are commercial.  Assuming 10% of both LDV’s and 2/3-wheelers are commercial, 770TWh will be private and about 230TWh will be business in the 2030 SDS.

Based on units, China currently leads and is forecast to lead the world in every mode and in charging by a wide margin.  The US is far behind both China and Europe in the adoption of all modes of EV’s except perhaps Trucks. Is this important?  I think so.  Most countries recognize the global warming crisis and are searching for cost effective responses. I believe that EV’s will be in more and more cases a cost effective response. Given current trends the world will not be turning to US made or designed EV’s. The US has to wake up to the threat of global warming at some point; hopefully soon.  Currently, I think it likely that the US itself will turn to overseas suppliers for most of it’s EV’s.

Posted in General | Tagged , , | Leave a comment

Thinking about E-Mobility in the Future

Thinking about E-Mobility in the Future

I have been thinking about how to think about e-mobility in the future. I believe it is useful to consider  four major influences on mobility needs: geographic distribution of work versus home, characteristics of the connecting network, characteristics of vehicles, and value and cost of trips over time. 

1.      Geographic distribution of work versus home. This might be generalized to daytime activities versus evening and night activities. This is a key influence on the number and patterns of trips. Consider the vastly different mobility needs if:

a.      Both people and jobs are packed into a relatively few metropolitan areas.

b.      People are spread across many smaller communities and jobs are packed into a relatively few metropolitan areas.

2.      Characteristics of the connecting network. Does the network consist of only 2-lane roads and freeways? Is there a dense rail network? Looking to the future, is the network electrified so that vehicles can obtain their energy directly from the network?

3.      Characteristics of vehicles. What is the energy source? How big is the vehicle? Is the vehicle autonomous? What is the individual vehicle’s capacity? What is an individual vehicle? (Are six coupled vehicles one or six vehicles?) And, many others.

4.      Value and cost of trips over time. When do activities begin and end? Does the cost of trips vary significantly across time? Most of these questions concern the peak loads on different paths through the network.

All of these influences interact. For example, re-imagining the networks allows us to re-imagine the vehicle. The current vision of electric vehicles seems limited to mimicking their fossil fuel counterparts. Each vehicle carries both its energy supply (gasoline or electricity) and its motor. But electric vehicles (EV’s) have another option which is to gather energy from the network (old fashioned electric trolleys or new-fangled embedded wires). While the idea of electrifying the network has not disappeared completely, it is not as common as it once was and certainly does not get the attention that battery technologies are receiving. But an electrified network offers a lot of advantages to EV’s. They can be smaller and lighter, go without fueling stops, and have much better inter-vehicle coordination. 

Posted in General | Leave a comment

Hopeful Paper on Greenhouse Gas Emissions

Hopeful Paper on Greenhouse Gas Emissions

A recent Lawrence Berkeley National Laboratory paper suggests that “California could cost -effectively achieve near-complete power-sector decarbonization by 2030 using existing technologies.  The results also indicate potential for similar opportunities in other regions of the world.” (Paper available here

I want to discuss why this is great news, a number of caveats, and raise questions about whether deep decarbonization of the California economy makes sense.

Again quoting the report, “Producing carbon-free electricity is the key to enabling carbon-free electrification of other sectors.”  (Such as transportation, buildings, and industry.) “Most analyses of near-complete power-sector decarbonization (80% decarbonization or greater) project achievement of this goal by no earlier than 2050 owing to high assumed renewable energy costs. Such a time frame provides little hope that climate change could be held to a manageable level in this century.”  Stating this another way, most researchers believe that the most likely path to limiting warming involves two steps. 1. Decarbonize the production of electricity. 2. Decarbonize other sectors by substituting electricity for fossil fuels.  Moving the date of economic decarbonization of electricity up by 20 years is wonderful news.

The figure below summarizes the economic results of the analysis for the Low Cost case.

Note that the 80% and 90% clean cases are very close in cost to the current policy case and less costly than the No New Clean energy case.  The authors make adjustments for subsidies.  They conservatively assume only minor improvements in matching load to supply availability. The authors make what I consider conservative estimates of technology progress on renewables and batteries.  They assume no additional progress in the  High Cost case and they assume progress at only half the rate of the past 7 years in the Low Cost case.

I have three major caveats or concerns about the analysis.  

  1. They include the current California charges for carbon emissions as costs to fossil generation.  These costs would not exist in most jurisdictions of the US and world.  On the other hand, I and I think most economists feel that such costs should exist everywhere and should be higher than those in California.
  2. They assume that the solar output on any day in California will be at least 80% of the average solar output on that day.  This is based on data that is aggregated over the US.  This assumption is critical in determining how much conventional generation is needed to back up the renewables plus batteries.  I think that this assumption needs much closer study.
  3. They use new solar and wind purchase agreements to estimate the most current costs for solar and wind.  The costs of these purchase agreements are very sensitive to how often solar and wind must be shut down or curtailed due to oversupply.  Sometimes, the sun shines too bright and/or the wind blows too hard and no one can use the electricity.  In those hours, curtailing solar and/or wind is the least costly response.  It is unclear how they adjust costs for these periods of curtailment. 

The figure below illustrates how important this third point is and, for me, raises questions about whether a policy of 90% or higher decarbonization of the California economy makes sense.

Note, the size of the red area in each month.  The red area represents curtailment of solar and wind. In every month of the year, solar must be disconnected and windmill blades must be stilled. This is nearly free energy that is not being used. The plants still must be paid for though they sit idle for substantial periods.  If the US and the world is near 90% decarbonization, this idle capacity is part of the cost and is probably worth it.  But if much of the world’s electric system is at 20% or less decarbonization, it would make much more sense for California to pay for building this solar and wind elsewhere.  The impact on global warming would be much, much greater.

Posted in General | Leave a comment

Electric System Impacts of Covid-19

Electric System Impacts of Covid-19

Covid-19 is having significant impacts on our energy system and through this on climate change. In this post, I review those immediate impacts and forecasts for the future, and comment on their implications for climate change. 

I have not posted for about 5 weeks.  About the length of time that I have been sheltering-in-place in California.  These are related.  I was fortunate to get a project examining impacts of Covid-19 on the electric system.  That and staying healthy is about all I have been thinking about. I need to preserve client confidentiality, so I can’t talk about my own work.

However, I just found a report by Brattle Group about energy impacts of Covid-19. I’ve worked with Brattle in the past and respect them highly. I will present a little of their work and comment on what I think it means for global warming. (Download the Brattle report here). The report is now two weeks old. Pandemic-news goes bad rapidly, but I believe the report is still very relevant.

Below is a table of GDP (GDP is one of the broadest measures of economic activity) projections from p. 10.

Most projections are for a sharp economic contraction (-8.4% to -34.0% in Q2 2020) and quick recovery (I’ve looked at more than a half dozen additional projections and they are similar).  While this is bad news, there is a silver lining from a global warming perspective. This slow down will be reflected in significantly reduced greenhouse gas emissions and, therefore, slower warming. I think that this slow down will dominate all the other global warming impacts of Covid-19.

Brattle states, “Global oil prices have declined massively as a result of the breakdown of OPEC+ negotiations in March and COVID-19-induced decreased demand.” p. 13.  I have posted the 3 month trend in WTI (a common crude oil) below. (Graph source here.)  We see a drop from over $50/bbl (barrel) to $15/bbl, with a low of about -$28/bbl.  No one could find storage, producers were willing to pay you $28/bbl to take crude.  Low prices are likely to persist throughout the recovery and this will help the recovery, but cheap oil will not be good for transportation electrification and global warming.

Brattle notes that transportation electrification will be further reduced as companies and consumers reduce their capital spending while they rebuild their bank accounts.

The graph below from Brattle p. 20 shows that electric loads are down in March for two of the large regional system operators and this is similar across the nation.  Part of this reduction is due to mild weather in much of the country, but Brattle suggests that about 4% of the reduction is related to Covid-19.  The reduction is caused by two very closely aligned but somewhat different factors: 1) the shelter-in-place restrictions that are changing how and where we work and 2) the economic slowdown.  Less electric use means less fossil fuels are burnt to generate electricity and this slows global warming.  Most or all of this effect is captured in the economy-emissions relationship noted above.

LOAD AT NYISO AND ISO-NE

“At ISO hubs, average peak forward prices for rest of 2020 dropped between $2.40- $4.50/MWh from February to April, but have not systematically fallen for 2021 and beyond.” (Brattle, p.24)  The forward prices are an indication of future wholesale electric prices.  These lower future electric prices put pressure on higher cost producers.  Currently in the US, that means coal plants. I think it unlikely that any coal plants will close specifically because of Covid-19, but it’s “another nail in the coffin.”  Good news for global warming.

The graph below, from p. 29 of the report, shows that, while US Treasury bond yields have been dropping, the utility bond yields have been going up.  Graphs on p. 31 show a similar pattern in market returns.  Together these mean that, in spite of government interest rate cuts, the financing cost for new electric power facilities is rising due to Covid-19. Rising costs will slow the building of new solar and wind generation.  While I don’t think this means longer lives for coal plants, I do believe that it will mean higher utilization and carbon emissions for aging gas power plants.  

In summary, it is a complex picture with less greenhouse gases in the short run somewhat balanced by a slowing of the structural changes that will move the US and the globe to a less carbon intensive future. 

Posted in General | Leave a comment

IPCC limiting warming 1.5°C

IPCC limiting warming 1.5°C

The Intergovernmental Panel on Climate Change (IPCC) is the United Nations’ body for assessing the science related to climate change. I believe the IPCC is the best source on the science and economics of climate change and mitigation. IPCC issued a major 2018 report examining the feasibility and the pros and cons of limiting warming to 1.5°C.  

I have been reading Chapter 2 of this report, Mitigation Pathways Compatible with 1.5°C in the Context of Sustainable Development.  (Report is found here.)  Below are some quotes from the report that I found important or surprising. Quotes are in italics with page number references.

“In model pathways with no or limited overshoot of 1.5°C, … CO2 emissions decline by about 45% from 2010 levels by 2030 …, reaching net zero around 2050 … For limiting global warming to below 2°C … CO2 emissions are projected to decline by about 25% by 2030… and reach net zero around 2070.” (p. 95)  Both of these 2030 goals seem incredibly aggressive in just 10 years.

“Other things being equal, modelling studies suggest the global … costs for limiting warming to 1.5°C being about 3–4 times higher compared to 2°C over the 21st century…”  (p.95) Limiting warming to 1.5°C requires greater emissions reductions than 2°C; therefore, it is more costly. That is not a surprise, but the magnitude of the cost is. 1.5°C isn’t just a little more costly, it is a lot more costly.  It emphasizes that we need to understand and communicate the benefits of aggressive action.

“By 2050, the carbon intensity of electricity decreases to −92 to +11 gCO2 MJ−1 (minimum–maximum range) from about 140 gCO2 MJ−1 in 2020, and electricity covers 34–71% (minimum–maximum range) of final energy across 1.5°C pathways with no or limited overshoot from about 20% in 2020.” (p.97)  Translation, by 2050 electricity production needs to be carbon free or actually absorbing carbon, and we need to double or triple the percent of the economy powered by electricity.  We need to electrify the transportation system and many heat loads.

“This assessment finds a larger remaining budget… from AR5 …which were approximately 1000 GtCO2 for the 2°C… and approximately 400 GtCO2 for the 1.5°C budget. In contrast, this assessment finds approximately 1600 GtCO2 for the 2°C … and approximately 860 GtCO2 for the 1.5°C budget ….” I include this because it is the only good news I found in the report.  The world can emit more CO2 and stay under the 1.5°C and 2°C targets than was thought 4 years ago.

The last item is a modified graph from the report (original at p.113)

This graph shows one idea of an efficient path that keeps the world under 1.5°C of temperature rise.  It assumes that the world will have moderate income growth, moderate population growth, moderate technology progress, etc.

Some acronym meanings: AFOLU – agriculture, forestry and other land-use, BECCS – bioenergy with carbon capture and storage, CCS – carbon capture and storage, CDR – carbon dioxide removal.  The black line in the graph is yearly net CO2 emissions. 

CO2 emissions from the electricity sector, the white region below the black line, go to zero about 2035.  Electric power globally is net zero in 15 years! For this to happen, we have to quit building coal plants worldwide very, very soon.  We need to start seeing substantial declines in emissions from buildings and transport beginning now. Emissions in industry do not need to start shrinking for another decade.  All of this needs to happen with a significantly growing economy in the developing world. I hope this all happens, but I think the odds are 1 in 4.

For me the biggest surprise in this and many of the other 1.5°C scenarios is the role of carbon capture and storage (CCS).  CCS progress has been dismal. Most people I know associate it with last ditch efforts to keep coal plants alive. About 2055 in this scenario, the world reaches net zero emissions.  Electric production, buildings, transportation, and industry are still emitting about 12 GT CO2. CCS is removing about 9 GT CO2. About 3 GT of this is from BECCS. That is carbon capture from burning energy crops.  This is such a surprise that I have to remind myself that many of the top experts think this has the best chance of success.

To summarize, the best science concludes that to stay under 1.5°C, the world needs to be moving very quickly.  The world’s electric system needs to be net carbon free in just 15 years and more of our final energy use needs to come from the electric system.  A big surprise to me is that carbon capture and storage is considered a major contributor to the reductions in net emissions.

Posted in General | Leave a comment

Challenges of Modeling Global Electric Vehicle (EV) Penetration

Challenges of Modeling Global Electric Vehicle (EV) Penetration

About 15% of global greenhouse gas emissions are from transportation.  Reducing these emissions is critical in curbing climate change. Policy makers, auto makers, concerned citizens, and others want to know how fast electricity will replace fossil fuels in transportation; but, forecasters face big challenges.

Recently, I have been reviewing public models that forecast purchases of light duty vehicles (cars, SUV’s, and pickups).  There are a number of such models available from the US national laboratories and other sources. I plan to use one of these models in a future project predicting regional EV penetration.  I am fascinated by the challenges faced and assumptions made by experts trying to predict global EV penetration. ADVANCE, a European project to improve cost-benefit analysis of climate change and control policies (Learn about ADVANCE here), provides a good example.

ADVANCE wanted to improve the transportation element of MESSAGE, a global climate integrated assessment model, by incorporating results and methods from MA3T, a light duty vehicle penetration model developed by Oak Ridge National Laboratories (Learn more about MA3T here).  This work is described by McCollum, et al (Find the Paper here and a   Supplement to paper here.). Quotes from the reports are italicized below.

The researchers felt that the MESSAGE model (and other integrated assessment models or IAM’s) that forecast EV penetration could be improved by increasing consumer heterogeneity and including non-monetary preferences.  (Non-monetary preferences are included as costs added to vehicle purchase cost.) 

Regarding heterogeneity, the researchers chose a three by three by three matrix to define 27 consumer segments. “These dimensions are chosen because the empirical evidence base suggests they … are important behavioral features of vehicle choice …

  1. Settlement pattern: Urban – Suburban – Rural
  2. Attitude toward technology adoption: Early Adopter – Early Majority – Late Majority
  3. Vehicle usage intensity: Modest Driver – Average Driver – Frequent Driver”

All consumers globally are placed into one of these segments. I am going to focus on the attitude-toward-technology-adoption dimension.  The percentage in each classification (Early Adopter, Early Majority, Late Majority) is kept constant over the two other dimensions and world regions. 

“Once a disaggregated set of heterogeneous agents has been programmed into the model, the second important step is to assign disutility costs to each of the vehicle technologies that can potentially be purchased by a consumer within a given group. These disutility costs are added as extra cost terms to the vehicle capital costs already assumed, and they vary by technology, by consumer group, by country/region, and over time. The costs have been calculated using a specialized version of the MA3T vehicle choice model.”

There are five disutility costs considered by the researchers:

  1. “Range anxiety (limited electric vehicle driving range)
  2. Refueling station availability, or lack thereof (for non-electric vehicles)
  3. Risk premium (attitude toward new technologies)
  4. Model availability (diversity of vehicles on offer)
  5. Electric vehicle charger installation (home/work/public)

As an example, the figure below shows the hard costs and disutility costs for battery electric vehicles (BEV) for two consumer segments in the US.  The Suburban, Late Majority, Frequent Driver perceives the cost of the BEV as being approximately double that of the Urban, Early Adopter, Modest Driver.  Note that the Urban, Early Adopter, Modest Driver perceives the risk premium as negative and the range anxiety as zero.

Everything described so far is a simplification of the US MA3T model.  The ADVANCE model has fewer consumer segments and fewer disutility measures.  The next step is bolder. “… we have determined through our analysis that the disutility costs generated by the model for the US can be extended to other countries and regions by applying simple ‘regional multipliers.’” The researchers use social value and driving pattern indicators in other countries to modify the disutility values for risk premium, range anxiety, and refueling station availability.

Adjustments for range anxiety and refueling station availability are based on a variety of international willingness-to-pay studies related specifically to range anxiety and refueling station availability.  33 studies for range anxiety and 6 for refueling station availability.

I find the modeling for risk premium the most interesting.  The risk premium, measured in $/vehicle, begins at a high absolute value for each consumer segment when there is zero stock for that type of vehicle.  For example before BEV’s were available in the US, the BEV risk premiums were at their highest. As BEV ownership grows, the risk premium goes exponentially to zero.  The risk premium for zero stock is different for different consumer segments but the same for all model regions. 

The risk premium rate of decline as ownership grows depends on a “social influence effect.” The social influence effect is a quantitative measure of the importance of social influence as measured by interpersonal networks, neighborhood effects, and social norms. (More on social influence effect here)  The higher the social influence effect, the more rapidly the risk premium goes to zero.  It makes sense that attitudes about new technology are important to estimating EV penetration.  I think that this quantification is creative and improves the prediction, but it also highlights the challenges and uncertainty in the prediction.

The researchers need further assumptions, because the social influence effect is only calculated for 11 countries.  The researchers assume this index is related to an index that has been calculated for over 80 countries. This is the “cultural values” scale, measured from ‘pragmatic’ to ‘normative,’  developed by Minkov and Hofstede (Minkov and  Hofstede paper available here). The linking of the “social influence effect” and the “cultural values” scale is another response to the challenges of the prediction problem. The graph that fits the “social influence effect” to “cultural values” is shown below.

I haven’t examined the accuracy of the ADVANCE predictions of electric vehicle penetration or compared their methodology to others.  I do think that their work illustrates well the challenges and uncertainties of global predictions and the creativity and care that researchers bring to the problem.

Posted in General | Leave a comment

The Focus of Future US Climate Policy, A Few Graphs Say a Lot

I have been looking at graphs from the Center for Climate and Energy Solutions (C2ES). My conclusion: “Think Globally, Act Locally” may be a great slogan for individuals, but it would make a lousy national climate policy.  (It would work better than the current policy of “Don’t Think, Don’t Act,” but not by a whole lot.)

The following two graphs are from C2ES and can be found here

Cumulative Emissions, 1751-2017

This graph shows cumulative post-industrial emissions.  The US and EU together account for nearly half the carbon in the atmosphere. A reasonable interpretation is that the climate change crisis has been caused by the developed world. 

Greenhouse Gas Emissions for Major Economies, 1990–2030

As the graph above shows, emissions in the EU-28, United States, Japan, and Russian Federation have largely stabilized and, particularly for the EU-28, are declining. Emissions from the developing world represented by Brazil, India, and China are projected to grow rapidly. Even very severe cuts in emissions from the developed world are highly unlikely to halt global warming.  A reasonable interpretation is that cuts have to be made in emissions from the projected or business-as-usual path of the developing world.

The graph above left puts the cumulative emissions on a per capita basis. (Data here). The graph above right shows per capita GDP.  Developing countries come to two reasonable conclusions. 1) The US and the EU have built their wealth based on greenhouse gas creation. 2) Developing countries should not have to cut their growth to solve a problem created by the developed world.

I think that It is extremely important that the next US President takes climate change seriously.  The question that she or he has to answer is not “What can we do to cut US emissions?” but “What can we do to help the world grow and cut emissions?”

Posted in General | Leave a comment

Three Major International Climate Agreements

Three Major International Climate Agreements

I started reading the Intergovernmental Panel on Climate Change “Global Warming of 1.5°C” report and decided I needed to get up to date on international climate change agreements.  Here are my personal and very incomplete high points.

1997 Kyoto Protocol.  This was the first major agreement addressing global warming.  There are 192 parties to the protocol. 38 developed nations participated and agreed to limit their greenhouse gas emissions (Annex 1 countries).  36 of these nations ratified the agreement and met their first commitment period (2008-2012) goals. The U.S. never ratified the agreement and Canada withdrew in 2011. In 2012, the Doha Amendment set 2nd period commitments (2013-2020) for 37 countries. As of January 2020, only 7 of the countries with firm commitments have ratified the agreement.  (Wikipedia Kyoto Protocol).  For practical purposes, the Kyoto Protocol has been supplanted by the 2016 Paris Agreement. Most commentaries I have read label the Kyoto Protocol a failure, but I think that is overly harsh.  It was a huge step forward in recognition of the climate change problem, and I think global emissions and even US emissions would have been significantly higher without it.

2010 Cancun Agreement. The Cancun Agreements had two critical positive outcomes. First,  “China and the United States were in a much more cooperative mode, avoiding blame games in the media and focusing on getting the job done.” More generally both developed countries and developing countries each compromised to create a better agreement. Second, the parties agreed to a $100 Billion per year fund (Green Climate Fund) by 2020 to support developing countries to mitigate and adapt to climate change. (World Resources Institute).  Unfortunately since Cancun firm greenhouse gas reduction commitments and resources to support developing countries have been lacking.  In 2019 the Green Climate Fund received less than $10 Billion in pledges. The United States pledged nothing. This is a long, long way from the $100 Billion per year agreed to in 2010. A global low carbon energy system is essential to prevent catastrophic climate change. I think that this fund or some alternative for a massive flow of capital from developed to developing countries is the only hope of achieving such an energy system.

2016 The Paris Agreement.  “The Paris Agreement central aim is to strengthen the global response to the threat of climate change by keeping a global temperature rise this century well below 2 degrees Celsius above pre-industrial levels and to pursue efforts to limit the temperature increase even further to 1.5 degrees Celsius. Additionally, the agreement aims to strengthen the ability of countries to deal with the impacts of climate change.” (Paris Agreement goal).  The Paris Agreement was a departure from earlier efforts.  The focus was on inclusiveness and transparency, rather than an agreement on specific greenhouse gas targets.  Each country sets its own target, “nationally determined contribution” (NDC). As of November 2019, 188 countries have become party to it.  Iran and Turkey are the only significant emitters that have never been party to the agreement. The US is scheduled to leave the agreement in November 2020. “While each Party’s NDC is not legally binding, the Parties are legally bound to have their progress tracked by technical expert review…nations must report every two years on their mitigation efforts…” Participants agree to report their contributions every 5 years and that new NDC’s will be more ambitious than older NDC’s (principle of progression).  It has been referred to as a “name and shame” system. The sum of the current NDC’s falls far short of what is necessary to limit temperature increases below 2°C.  (Wikipedia Paris Agreement)

Looking for good news against a background of minor achievements.  Given the lack of leadership and investment, the world has made remarkable technological advancements in cutting the emissions from energy production.  I include in these the drop in costs of both renewables and natural gas. My hope is that in the next year we see a dramatic change in the US position on climate change.  And, that leads in turn to more aggressive action in China and India. 

Posted in General | Tagged , , | Leave a comment